Con uno studio internazionale si è analizzata, fin nei minimi dettagli, la dinamica della slavina che nel 2017 travolse l’hotel di Rigopiano, riportando con esattezza la cronologia dell’accaduto
Il 18 gennaio 2017 una valanga nella località di Rigopiano in Abruzzo colpì rovinosamente un Resort-hotel. L’evento, che determinò la perdita di alcune persone, fu osservato solo da due testimoni che, fortunosamente, si trovavano all'esterno dell’edificio.
Tanti sono gli interrogativi e le ipotesi che ruotano intorno a questa tragica vicenda. Uno studio multidisciplinare a cura dell'Istituto Nazionale di Geofisica e Vulcanologia, del Politecnico di Torino, del WSL Institute for Snow and Avalanche Research SLF di Davos (CH) e dell’Osservatorio di Geofisica dell’Università di Monaco (DE) ha cercato di fornire delle risposte sulle tempistiche e sulle dinamiche della valanga.
La ricerca “Seismic signature of the deadly snow avalanche of January 18, 2017, at Rigopiano (Italy)”, appena pubblicata sulla rivista Scientific Reports, ha appurato che tutto è accaduto in poco meno di un minuto e mezzo. La valanga si è staccata dal Monte Siella alle ore 15:41:59 (orari UTC), nel suo percorso verso la valle è entrata in un canyon e all’incirca alle 15:43:20 ha colpito l’hotel di Rigopiano ad una velocità di circa 100 km orari.
Per giungere a questo risultato così preciso, i ricercatori hanno prima analizzato la tempistica delle telefonate di soccorso così come riportate dalla cronaca giornalistica e poi valutato numerosi dati tra cui l’analisi della Rete Sismica Nazionale e la modellazione numerica della valanga, elaborati poi in studi ingegneristici e sismogrammi teorici ottenuti attraverso simulazioni.
Questo lavoro così complesso e multidisciplinare evidenzia una nuova lettura della dinamica dell'evento suggerendo, tra l’altro, potenziali utilizzi non tradizionali di una rete di monitoraggio sismico.
“Una prima ipotesi”, afferma Thomas Braun, uno degli autori della ricerca, “nata dall’osservazione di un segnale sismico sospetto, è stata quella che tale segnale fosse dato dall’impatto della valanga stessa con l’albergo. Un’analisi più approfondita ha rivelato, invece, l’esistenza di tre distinte fasi sismiche, che potevano sostenere una seconda ipotesi, quella che la valanga si fosse propagata verso valle in tre fasi consecutive.
Per giungere a questi risultati come prima cosa abbiamo ristretto la finestra temporale in cui è avvenuta la valanga”, spiega Thomas Braun, “Per fare ciò ci siamo basati sulla cronologia e sul contenuto delle chiamate e dei messaggi di emergenza inviati dall’hotel. Alle 15:30 (orari UTC) è avvenuta l’ultima chiamata dalla struttura mentre alle 15:54 c’è stato un tentativo di invio di un messaggio WhatsApp di richiesta di aiuto da una persona rimasta bloccata dalla neve. Abbiamo dedotto che la valanga è avvenuta in questa finestra temporale di 24 minuti. Successivamente abbiamo cercato dei segnali sismici ipoteticamente generati dalla valanga. In quel periodo eravamo nel pieno della sequenza sismica dell’Italia centrale, con epicentri a circa 45 km a ovest di Rigopiano. Analizzando i segnali registrati dalle stazioni sismiche, abbiamo notato che la stazione GIGS posizionata sotto il Gran Sasso, aveva registrato un segnale anomalo nei 24 minuti identificati come finestra temporale del distacco della valanga. Di questo segnale”, prosegue il ricercatore, “abbiamo poi studiato il contenuto spettrale e la direzione di provenienza osservando così tre distinte fasi sismiche avvenute a distanza di pochi secondi. La domanda decisiva che nasce da tale osservazione è come una valanga, che si muove in superficie, possa trasmettere energia sismica nel sottosuolo.
Sulla base della topografia del luogo, tenendo conto della tipologia, della temperatura e dell’umidità della neve, sono state eseguite centinaia di modellazioni numeriche per ricostruire il tragitto e la dinamica della valanga, che hanno fornito risposta al quesito: lungo la traiettoria della valanga esistono tre punti dove il “momento”, dato dal prodotto altezza per velocità della valanga, diventa massimale. Questi punti corrispondono al passaggio della valanga nel canyon, esattamente all’entrata e alle due successive deflessioni. Il lavoro appena pubblicato ha quindi permesso di sincronizzare le modellazioni con le osservazioni e di stimare i tempi dell’evento.
“La ricostruzione dell’evento”, aggiunge Thomas Braun, “ha evidenziato che la valanga nella discesa verso valle ha percorso in tutto 2400 metri e ha travolto alberi e rocce, cambiando massa con incremento continuo del proprio peso specifico. Oggi sappiamo che la velocità con cui la valanga ha colpito l’albergo è stata di 28 metri al secondo, quasi 100 km orari. I ricercatori dell’Università di Monaco hanno calcolato dei sismogrammi teorici che - comparati con il segnale registrato alla stazione GIGS - trovano maggiore coerenza se si assume che il segnale sismico fosse stato generato durante il passaggio della valanga nel canyon.
I ricercatori del Politecnico di Torino, invece, hanno studiato in dettaglio, dal punto di vista ingegneristico, l’impatto, il collasso e la dislocazione dell’edificio principale dell’hotel e, insieme con il WSL Institute for Snow and Avalanche Research SLF di Davos, hanno indagato sulla dinamica della valanga analizzando la topografia del pendio prima e dopo l’evento.
“Attraverso le nostre analisi”, conclude il ricercatore, “è stato possibile determinare anche l’esatto orario in cui si è generata la valanga e quello in cui è stato colpito l’hotel.
Applicando questa metodologia multidisciplinare, si può quindi immaginare un potenziale uso della rete di stazioni sismiche, appositamente configurata per i territori montani, per monitorare valanghe in luoghi remoti e impervi, utile per una più completa comprensione del fenomeno”.
#ingv #politecnicoditorino #WSL #valanga #retesismicanazionale #universitàdimonaco
Rigopiano: identified the characteristics and the exact timing of the avalanche
By means of an international study, the dynamics of the avalanche that hit the hotel at Rigopiano in 2017 has been analysed down to the smallest detail, accurately reporting the event chronology
On 18 January 2017, an avalanche in the municipality of Rigopiano in Abruzzo devastated a Resort-hotel. The event, which caused the loss of some people, was observed only by two witnesses who stayed fortunately outside the building.
Many are the questions and hypotheses around this tragic event. A multidisciplinary study conducted by the National Institute of Geophysics and Volcanology, the Polytechnic University of Turin, the WSL Institute for Snow and Avalanche Research SLF in Davos (CH) and the Geophysical Observatory of the University of Munich (DE) tried to provide responses on the timing and on the dynamics of the avalanche.
The research "Seismic signature of the deadly snow avalanche of January 18, 2017, at Rigopiano (Italy)", just published in Scientific Reports, revealed that everything happened in less than one and a half minutes. The avalanche detached from Mt. Siella at 15:41:59 (UTC), on its way down to the valley entered a canyon and hit the hotel approximately at 15:43:20 at a speed of about 100 km per hour.
To achieve such a precise result, the researchers first analysed the timing of the emergency calls as reported in the news and evaluated then numerous data, like the analysis of the National Seismic Network and the numerical modelling of the avalanche, subsequently elaborated in engineering studies and theoretical seismograms obtained through simulations.
This complex and multidisciplinary work evidences a new interpretation concerning the dynamic of the event, suggesting, moreover, potential non-traditional use of a seismic monitoring network.
"A first hypothesis", affirms Thomas Braun, one of the authors of the research, "born from the observation of a suspicious seismic signal, was that this signal would have been generated by the impact of the avalanche with the hotel. An in-depth analysis revealed, however, the existence of three distinct seismic phases, which could support a second hypothesis, that the avalanche would have propagated in three consecutive phases.
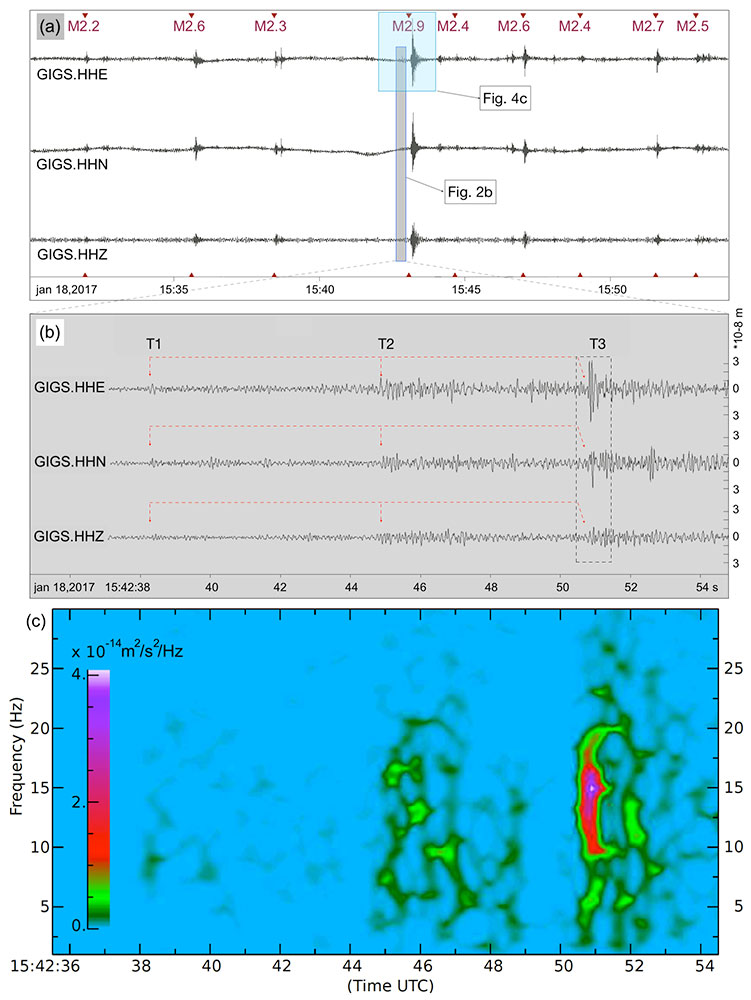
To achieve these results, we first restricted the time window in which the avalanche occurred", explains Thomas Braun, "To do this, we relied on the chronology and contents of the calls and emergency messages sent from the hotel. At 3:30 pm (UTC time) the last call from the facility took place while at 3:54 pm there was an attempt to send a WhatsApp message requesting help from a person blocked by the snow. We deduced that the avalanche occurred in this 24-minute time window. We then looked for seismic signals hypothetically generated by the avalanche. In those days we were in the midst of the central Italy seismic sequence, with epicentres about 45 km west of Rigopiano. Analysing the signals recorded by the seismic stations, we noticed that station GIGS located under the Gran Sasso, had recorded an anomalous signal within the 24 minutes identified as the time window of the avalanche release. Concerning this signal”, continues the researcher, “we then studied its spectral content and the direction of origin, thus observing three distinct seismic phases which occurred a few seconds apart. The decisive question that arises from this observation is how an avalanche, moving on the surface, can transmit seismic energy in the subsoil.
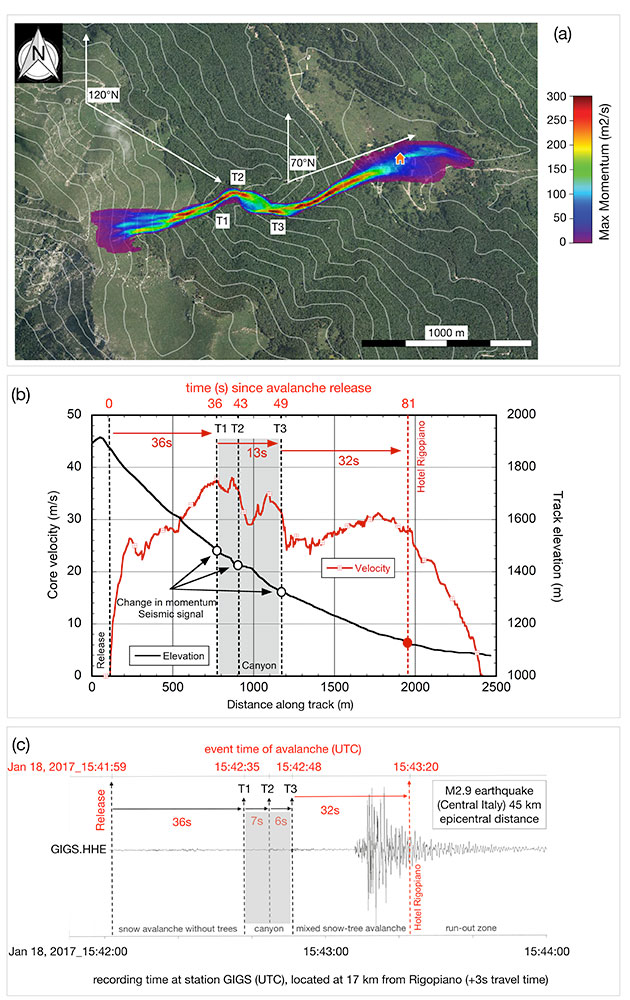
On the basis of the topography of the place, taking into account the type, temperature and humidity of the snow, hundreds of numerical modelling were carried out to reconstruct the path and dynamics of the avalanche, which provided an answer to the question: along the avalanche trajectory there are three points where the "moment" (given by the product of height by velocity of the avalanche) becomes maximum. These points correspond to the passage of the avalanche through the canyon, exactly, at the entrance, and the two subsequent deflections. The work just published has therefore made it possible to synchronize the modelling with the observations and to estimate the timing of the event.
"The reconstruction of the event", adds Thomas Braun, "showed that the avalanche on its descent into the valley covered a total of 2400 meters and swept over trees and rocks, changing mass with a continuous increase in its specific weight. Today we know that the speed with which the avalanche hit the hotel was 28 meters per second, almost 100 km per hour. The researchers of the University of Munich calculated theoretical seismograms which - compared with the signal recorded at station GIGS – are more coherent, when assuming that the seismic signal was generated during the passage through the canyon.
The researchers of the Polytechnic University of Turin, however, supported the detailed study from an engineering point of view, focusing on the impact, collapse and displacement of the main building of the hotel and, together with the WSL Institute for Snow and Avalanche Research SLF of Davos, investigating the dynamics of the avalanche by comparing the topography of the slope before and after the event.
"Through our analyses", concludes the researcher, "it was also possible to determine the exact moment when the avalanche was generated and when the hotel was hit.
By applying this multidisciplinary methodology it is possible to imagine a potential use of a seismic network, specifically configured for mountain areas, to monitor avalanches in remote and inaccessible places, useful for a more complete understanding of the phenomenon".
#ingv #UniversityofTurin #WSL #University of Munich #seismicmonitoringnetwork #avalanche

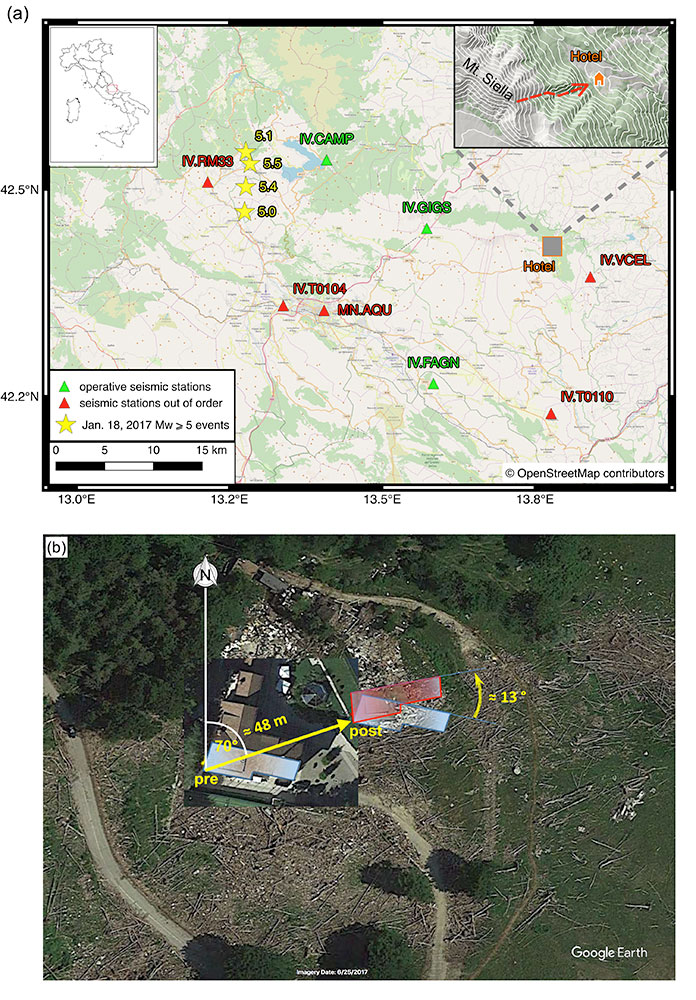
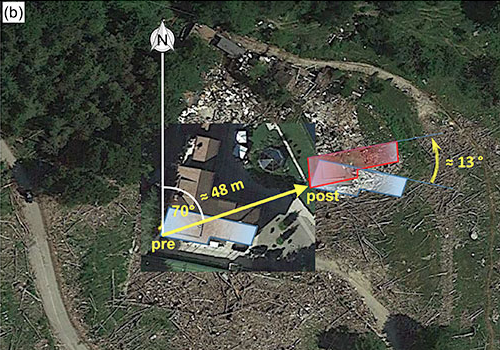
didascalia: Figura 1: (a) Stazioni sismiche della rete INGV (triangoli) installati in Abruzzo. Gli asterischi gialli indicano i terremoti del 18 Gennaio 2017 con epicentri vicini a Campotosto, che si sono verificati alle ore UTC 09:25:40 (Mw5.1), 10:14:09 (Mw 5.5), 10:25:23 (Mw 5.4), e 13:33:36 (Mw 5.0). Solamente la stazione GIGS, sito a 17 km ovest di Rigopiano, ha registrato un segnale sismico, associabile alla valanga che colpì l’albergo. (b) La valanga causò la dislocazione del primo piano dell’albergo di 48 m in direzione 70°N e una rotazione di ~13°in senso antiorario.
caption: Figure 1: (a) Seismic stations of the INGV-network (triangles) installed in the Abruzzo area. The yellow stars indicate the earthquakes on January 18, 2017, with epicentres near Campotosto, which occurred at UTC 09:25:40 (Mw5.1), 10:14:09 (Mw 5.5), 10:25:23 (Mw 5.4), and 13:33:36 (Mw 5.0). Only station GIGS, situated at 17 km W of Rigopiano, recorded a seismic signal related to the avalanche that hit the hotel. (b) The avalanche caused a dislocation of the hotel’s upper floor by 48 m in ~70°N direction and a ~13° anticlockwise rotation.

didascalia: Figura 2: Traccie sismiche registrate alla stazione GIGS: (a) una finestra temporale di 24 min intorno all’evento della valanga, (b) ingrandimento di 20 s della traccia in spostamento, indicando tre fasi distinte generate dalla valanga, (c) spettrogramma della componente E (station GIGS) illustrato per la finestra temporale di 20 s indicata in Fig. 2b.
caption: Figure 2: Seismic traces recorded at station GIGS: (a) a time window of 24 min around the avalanche event, (b) 20 s zoom of the displacement trace, indicating three distinct phases T1,T2 T3 generated by the avalanche, (c) spectrogram of the E-component (station GIGS) plotted for the 20 s-time window of Figure 2b.

didascalia Figura 3:
Simulazione della traiettoria della valanga del 18 Gennaio 2017 a Ricopiano e comparazione con il segnale sismico: (a) progressione del “momento” modellato lungo il percorso della valanga. All’entrata nel canyon (T1), e i punti di deflessione (T2, T3) si aspettano valori massimali del momento. (b) Quota del percorso (linea nera), velocità della valanga (linea rossa) e il corrispondente tempo (s) a seguito del distacco, in funzione della distanza dall’area di rilascio. (c) Componente E della registrazione sismica, indicando i tempi d’arrivo dei tre transienti sismici (a 15:42:38, 45 and 51 UTC). La valanga raggiunge l’albergo dopo circa 81 s.
caption: Figure 3:
Track simulation of the Rigopiano avalanche of January 18, 2017, and comparison with the seismic signal: (a) progression of the modelled momentum along the avalanche track. At the entrance into the canyon (T1), and the deflection points (T2, T3) maximum momentum changes are expected. (b) Track elevation (black line), avalanche velocity (red line) and corresponding Time (s) after nucleation, as function of distance from the release area. (c) E-component of seismic recording, indicating the onset times of the three seismic transients (at 15:42:38, 45 and 51 UTC). The avalanche reaches the Hotel after approximately 81 s


