Elaborati nuovi modelli geochimici per fornire un ulteriore strumento di interpretazione e comprensione degli eventi eruttivi, anche ai fini della valutazione della pericolosità nelle crisi vulcaniche.
Combinando la stima della ricarica del magma in profondità con le misure del degassamento vulcanico, un team di ricercatori dell’Osservatorio Etneo e della Sezione di Palermo dell’Istituto Nazionale di Geofisica e Vulcanologia (INGV) ha quantificato l’elevata pressurizzazione in cui si trovava l'Etna prima dell'inizio dell'eruzione del dicembre 2018.
I risultati sono contenuti nello studio ‘Intense overpressurization at basaltic open-conduit volcanoes as inferred by geochemical signals: the case of the Mt Etna December 2018 eruption’, appena pubblicato sulla rivista Science Advances.
L’Etna, infatti, è stato utilizzato come caso studio grazie all’importante estensione delle reti di monitoraggio e sorveglianza, sviluppate anche nell’ambito della cooperazione tra INGV e Dipartimento della Protezione Civile, atte a misurare il degassamento del vulcano.
Lo studio ha affrontato la questione irrisolta del bilancio tra i gas esistenti in profondità in un sistema vulcanico e il loro degassamento in superficie. Gli scienziati hanno valutato, in primis, le misurazioni dei flussi e della composizione chimica dei gas vulcanici emessi dall’Etna a partire da un paio di anni prima dell'attività eruttiva indagata.
L’idea innovativa si è sviluppata confrontando la quantità di gas emessi in atmosfera e quella risalente dalla crosta profonda insieme al magma. Quest’ultima è stata calcolata tramite un originale approccio individuato nella recente ricerca dell’INGV “Temporal variations of helium isotopes in volcanic gases quantify pre-eruptive refill and pressurization in magma reservoirs:The Mount Etna case”, che utilizza i dati geochimici in un modello fisico e chimico di pressurizzazione della camera magmatica. Si è dunque quantificato che, al momento dell’eruzione di dicembre, il sistema vulcanico aveva già accumulato una quantità enorme di fluidi magmatici che non avrebbe potuto essere efficacemente rilasciata dal normale degassamento vulcanico. In tal modo, si è resa disponibile l'energia necessaria per l’intrusione di due dicchi (ovvero, fratturazioni subverticali delle rocce, determinate dalla spinta del magma in risalita) e per l’apertura della frattura eruttiva, riattivando lo scivolamento del fianco orientale della montagna ed innescando, infine, l'esplosione parossistica.
“Il nostro studio ha evidenziato un disequilibrio tra la quantità di gas normalmente risalente con il magma dal mantello al di sotto di un vulcano e quella emessa nelle fasi pre- e inter-eruttive”, spiega Antonio Paonita, ricercatore dell’INGV. “Riconoscere e quantificare quasi in real time tale ‘disequilibrio’ e la sua evoluzione fornisce una nuova chiave interpretativa per la valutazione dello “stato di attività” del vulcano. Questo aspetto può essere molto importante anche per contribuire alla previsione dell’attività vulcanica specialmente in zone in cui si registra un’alta densità di popolazione”.
Lo sbilanciamento tra gas accumulati in profondità e quelli emessi in superficie si aggiunge alla ben nota discrepanza tra i volumi di magma che si stima siano immagazzinati nella crosta rispetto ai volumi effettivamente emessi in superficie, argomento ancora di vivace dibattito nella comunità scientifica.
“Sono stati elaborati modelli termodinamici del degassamento magmatico dell’eruzione di dicembre 2018”, spiega il ricercatore. “In tal modo, abbiamo rilevato che i vari tipi di segnali geochimici da noi monitorati ‘vedono’ diverse finestre di profondità nel sistema di alimentazione del magma, permettendo di seguire la tempistica della risalita magmatica e di ipotizzare che la preparazione dell’eruzione di dicembre iniziò quasi due anni prima dell’evento stesso”.
Infatti, altro aspetto interessante che è derivato dallo studio riguarda la stima dei tempi di realizzazione dell’intero processo che lega i fenomeni profondi alle manifestazioni superficiali osservate.
“Abbiamo potuto osservare che il processo eruttivo complessivo dell’eruzione di dicembre, inteso come quello che lega l’inizio dell’input magmatico profondo alla manifestazione eruttiva in superficie, è durato circa due anni. Questo lungo processo di accumulo non si esaurisce quasi mai in un unico evento eruttivo, per quanto violento, ma necessita di tempi lunghi per poter essere dissipato. L’Etna ci conferma continuamente questo aspetto con le sue attività eruttive molto frequenti, tra cui emergono eventi particolarmente energetici come l’eruzione del 2018, e che alla lunga tentano di riportare un equilibrio tra ingressi di fluidi e magma dal profondo ed emissioni di lava e gas in superficie”.
“I risultati dello studio”, conclude Paonita, “rappresentano un significativo passo avanti nella comprensione dell'escalation delle eruzioni nel vulcanismo basaltico in generale. L'Etna è l'archetipo di un sistema basaltico a condotto aperto ed è probabile che processi simili operino in molti vulcani in tutto il mondo”
La ricerca pubblicata ha una valenza essenzialmente scientifica, priva al momento di immediate implicazioni in merito agli aspetti di protezione civile.
Link:
---
The evaluation of the magmatic degassing is useful for understanding the eruptions of basaltic volcanoes
New geochemical models have been developed to provide a further tool for the interpretation and understanding of eruptive events, also for the purpose of assessing the hazard in volcanic crises
By combining the estimation of magma recharge at depth with the volcanic degassing measurements, a team of researchers from the Osservatorio Etneo and the Palermo Section of the Istituto Nazionale di Geofisica e Vulcanologia (INGV) quantified the high pressurization which featuredMount Etna before the start of the December 2018 eruption.
The results are contained in the study 'Intense overpressurization at basaltic open-conduit volcanoes as inferred by geochemical signals: the case of the Mt Etna December 2018 eruption', just published in the journal Science Advances.
Etna was used as a case study thanks to the important extension of the monitoring and surveillance networks designed to measure the degassing of the volcano, developed as part of the cooperation program between INGV and the Italian Department of Civil Protection.
The study addressed the unsolved question of the balance between gases existing at depth in a volcanic system and their degassing at the surface. Scientists first of all considered the measurements of the output and chemical composition of the volcanic gases emitted by Etna, starting from some years before the investigated eruptive activity. The innovative idea consisted in comparing the amount of gas emitted into the atmosphere and that coming from the deep crust together with the magma. The latter was calculated by using an original approach developed in the recent INGV research "Temporal variations of helium isotopes in volcanic gases quantify pre-eruptive refill and pressurization in magma reservoirs: The Mount Etna case", which uses geochemical data into a physical and chemical model of pressurization of the magma chamber. It was quantified that, at the time of the December eruption, the volcanic system had already accumulated an enormous amount of magmatic fluids that could not have been effectively released by normal volcanic degassing. In this way, the required energy was made available for the intrusion of two dikes (sub-vertical fractures of the rocks determined by the thrust of the rising magma) and for the opening of the eruptive fracture, also reactivating the sliding of the eastern flank of the mountain and finally triggering the paroxysmal explosion.
“Our study highlighted an imbalance between the amount of gas normally rising with the magma from the mantle beneath a volcano and that emitted in pre- and inter-eruptive phases", explains Antonio Paonita, researcher at INGV. "Recognizing and quantifying this 'imbalance' and its evolution almost in real time provides a new interpretative key for evaluating the ‘state of activity’ of the volcano. This aspect can also be very important in contributing to the prediction of volcanic activity, especially in areas where there is a high population density”.
The imbalance between accumulated gases at depth and those emitted at the surface parallels the well-known discrepancy between the volumes of magma that are estimated to be stored in the crust compared to the volumes actually emitted to the surface, a subject still of lively debate in the scientific community.
“Thermodynamic models of the magmatic degassing of the December 2018 eruption have been developed", explains the researcher. "In doing so, we found that the various types of geochemical signals we monitored 'see' different depth windows in the magma supply system, allowing us to follow the timing of the magma rise and to hypothesize that the preparation of the December eruption started almost two years before the event itself”.
Another interesting aspect that in fact arose from the study concerns the estimation of the preparatory times of the entire process that links the onset of the magma dynamics at depth to the observed phenomena at the surface.
“We observed that the overall eruptive process of the December eruption, regarded as the one that links the beginning of the deep magmatic input to the eruptive manifestation on the surface, lasted about two years. This long process of accumulation almost never ends bya single eruptive event, even if very violent, but requires a long time to be dissipated. Etna continuously confirms this aspect with its very frequent eruptive activities, among which we observe particularly energetic events such as the eruption of 2018. In the long run they try to restore a balance between the inputs of fluids and magma from the depths versus lava and gas emissions at the surface”.
“The results of the study”, concludes Paonita, “represent a significant step forward in understanding the escalation of eruptions in basaltic volcanism in general. Etna is the archetype of an open-conduit basaltic system and it is likely that similar processes work in many volcanoes around the world”.
The published research has an essentially scientific value, currently devoid of immediate implications regarding the aspects of civil protection.
Link:

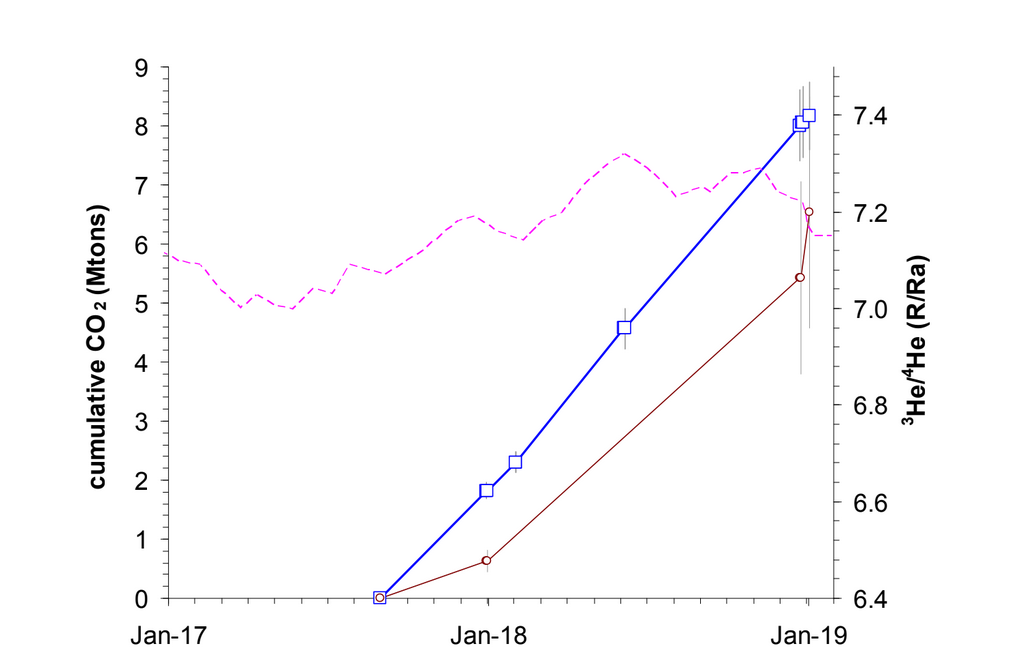
Fig. 1 - Input e output cumulativi di CO2. Quantità cumulativa di CO2 immessa nel sistema magmatico dalla profondità (linea blu) ed emessa dal degassamento del plume (linea marrone). È mostrato anche il segnale del rapporto isotopico di He del sito P39 (rosa tratteggiato).
Fig. 1 - Cumulative input and output of CO2. Cumulative amount of CO2 inputted into the magmatic system from depth (blue line) and outputted from plume degassing (brown line). He isotope signal from the P39 site is also shown (dashed pink).

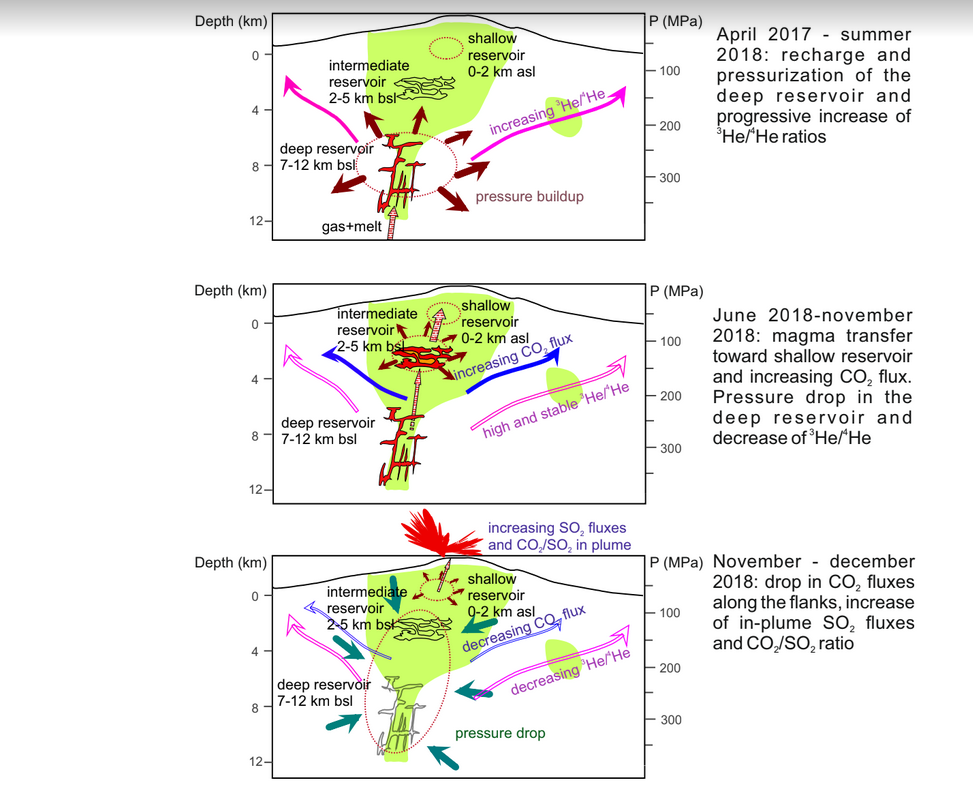
Fig. 2 - Schema del sistema magmatico dell'Etna che ha alimentato l'eruzione del dicembre 2018. Dall'alto, la lunga ricarica di magma e fluidi in profondità, il trasferimento del magma in tutto il sistema intermedio fino alla base dell'edificio vulcanico da giugno a novembre 2018, e infine la pressurizzazione del sistema di accumulo nei condotti (2-3 km sotto i crateri) e la decompressione del sistema di alimentazione profondo e intermedio.
Fig. 2 - Sketch of the Mt Etna magmatic system feeding the December 2018 eruption. From the top, the long-lasting magma and fluid recharge at depth, the magma transfer throughout the intermediate system up to the base of the volcanic edifice from June to November 2018, and finally the coupled pressurization of the conduit storage system (2-3 km below the craters) and decompression of the deep and intermediate reservoirs.

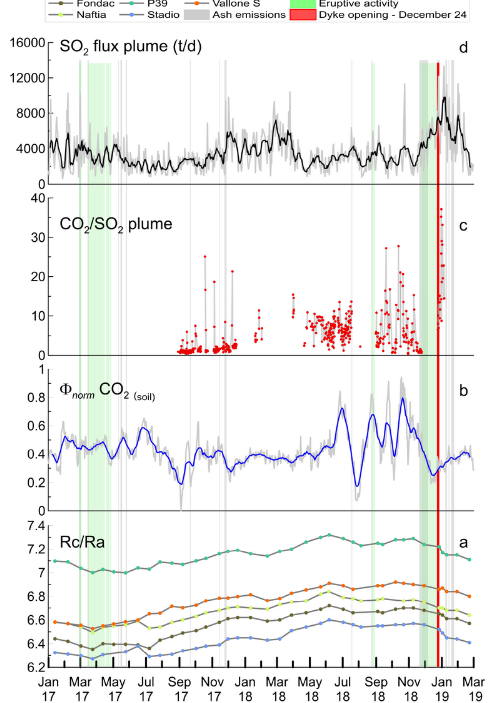
Fig. 3 - Segnali geochimici nel periodo luglio 2017 - febbraio 2019. Dal basso verso l'alto: a) rapporto isotopico 3He/4He nei gas periferici (come R/Ra, dove R=rapporto isotopico nel campione ed Ra=rapporto isotopico in atmosfera); b) Curva normalizzata dei flussi totali di CO2 emessa dai suoli, registrata dalla rete EtnaGAS (media giornaliera e media mobile su base settimanale, rispettivamente come linea grigia e blu); c) rapporto CO2/SO2 misurato nel plume dell'Etna, e d) flusso giornaliero e settimanale di SO2 misurato nel pennacchio vulcanico (rispettivamente linea grigia e nera). L'attività vulcanica del periodo studiato è evidenziata distinguendo eventi eruttivi ed emissione di cenere (fasce verdi, grigie) e la fase eruttiva del 24 dicembre (banda rossa).
Fig. 3 - Investigated geochemical signals in the period July 2017 - February 2019. From bottom to the top: a) 3He/4He isotope ratio in peripheral gas vents (as R/Ra, being R=the isotope ratio in the sample and Ra=the isotope ratio in air); b) Normalized curve of the total flows of CO2 exhaling from the soils recorded by the EtnaGAS network (daily and running average on weekly basis as grey and blue line, respectively); c) CO2/SO2 ratio measured in the Etna plume, and d) the daily and weekly bulk SO2 flux measured in the volcanic plume (grey and black line, respectively). The volcano activity of the studied period is also shown by distinguishing eruptive and ash emission events (green, grey headbands) and the eruptive phase of December 24 (red band).


