Prodotte immagini ad alta risoluzione delle rocce al di sotto della calotta glaciale della Groenlandia attraverso le onde sismiche.
Avvalersi del ‘rumore’ generato dalle tempeste oceaniche per creare un modello dettagliato delle condizioni geologiche sottostanti la calotta glaciale della Groenlandia. È l’obiettivo che si è posto un team internazionale di ricercatori della Swansea University e University College London in collaborazione con l’Istituto Nazionale di Geofisica e Vulcanologia (INGV), nello studio “Uppermost crustal structure regulates the flow of the Greenland Ice Sheet“ pubblicato sulla rivista Nature Communications.
“La calotta glaciale della Groenlandia”, spiega Andrea Morelli, ricercatore dell’INGV e coautore dello studio, “è il secondo più grande serbatoio di acqua dolce sulla Terra. Tuttavia, il tasso di perdita di massa di ghiaccio è aumentato di sei volte dal 1991, il che rappresenta circa il 10% del recente aumento del livello globale del mare”.
Le condizioni geologiche del terreno sotto una calotta glaciale o un ghiacciaio giocano un ruolo chiave nel determinare i movimenti dei ghiacci e identificare quali aree sono le più suscettibili.
“I principali fattori da considerare”, prosegue Morelli, “includono la composizione geologica degli strati di roccia, la temperatura della crosta terrestre sottostante e la quantità di acqua presente in forma liquida tra roccia e ghiaccio, giacché essa funge da lubrificante accelerando il flusso verso l’oceano con il conseguente innalzamento del livello del mare”.
Il problema, tuttavia, è come valutare ciò che sta accadendo in profondità nel sottosuolo, in quanto la roccia è ricoperta da uno strato di ghiaccio spesso circa 2,5 chilometri.
“Misurando la forma e la velocità delle onde sismiche - chiamate ‘di Rayleigh’ - estratte dal rumore terrestre”, aggiunge il ricercatore, “siamo stati in grado di mappare ciò che sta accadendo fino a 5 chilometri al di sotto della calotta glaciale della Groenlandia. Queste onde, viaggiano lungo la superficie terrestre e sono sensibili alle variazioni delle proprietà della Terra”.
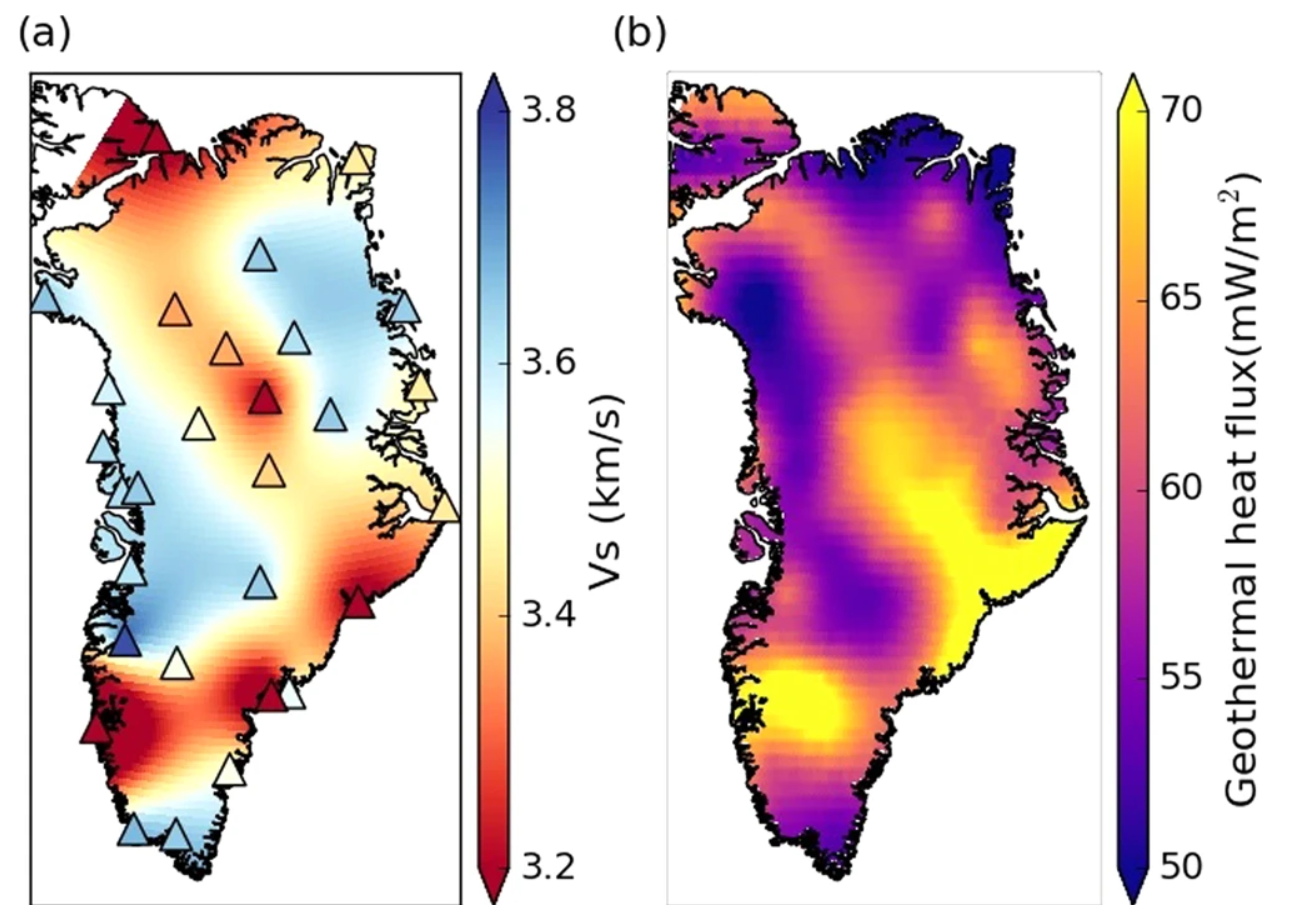
I ricercatori, quindi, analizzando le onde sismiche sono riusciti ad elaborare immagini ad alta risoluzione che, nelle parole di Andrea Morelli, “hanno mostrato che le basse velocità nella crosta superiore tendono ad essere associate ai principali ghiacciai di sbocco lungo il margine della calotta glaciale e all'elevato flusso di calore geotermico prodotto, nel corso della storia geologica, dalla stessa struttura profonda ora responsabile del vulcanismo in Islanda. I ghiacciai meno spessi sono particolarmente suscettibili allo scorrimento sui sedimenti subglaciali deformabili, mentre il riscaldamento geotermico e il conseguente ammorbidimento del ghiaccio basale possono influenzare l’aumento di velocità del flusso di ghiaccio al ghiacciaio Petermann e nella corrente di ghiaccio della Groenlandia nordorientale”.
“La ricerca”, conclude Andrea Morelli, “evidenzia l'importanza dell'interazione tra la terra solida e la dinamica della calotta glaciale. Queste interazioni ne controllano le dinamiche di scorrimento passate, presenti e future e devono essere adeguatamente esplorate e implementate nei modelli della calotta glaciale”.
Link:
---
See beneath the Greenland ice sheet through the noise of the Earth
Produced high-resolution images of the rocks beneath the Greenland ice sheet through seismic waves.
Using the 'noise' generated by ocean storms to create a detailed model of the geological conditions underlying the Greenland ice sheet. This is the goal that an international team of researchers from Swansea University and University College London set themselves in collaboration with the Italian Istituto Nazionale di Geofisica e Vulcanologia (INGV), in the study "Uppermost crustal structure regulates the flow of the Greenland Ice Sheet" published in the journal Nature Communications.
"The Greenland ice sheet", explains Andrea Morelli, researcher at INGV and co-author of the study, "is the second largest freshwater reservoir on Earth. However, the rate of ice mass loss has increased sixfold since 1991, which represents about 10% of the recent global sea level rise".
The geological conditions of the ground under an ice sheet or glacier play a key role in determining the movements of the ice and identifying which areas are the most susceptible.
"The main factors to consider", continues Morelli, "include the geological composition of the rock layers, the temperature of the underlying earth's crust and the amount of water present in liquid form between the rock and ice, since it acts as a lubricant accelerating the flow towards the ocean with the consequent rise in sea level".
The problem, however, is how to assess what is happening deep underground, as the rock is covered in a layer of ice about 2.5 kilometers thick.
"By measuring the shape and speed of the seismic waves - called 'Rayleigh' - extracted from the earth's noise", adds the researcher, "we were able to map what is happening down to 5 kilometers below the Greenland ice sheet. These waves travel along the Earth's surface and are sensitive to changes in the properties of the Earth”.
The researchers, therefore, by analyzing the seismic waves were able to elaborate high resolution images which, as Andrea Morelli says, "showed that the low velocities in the upper crust tend to be associated with the main outlet glaciers along the edge of the ice cap and to the high flow of geothermal heat produced, over the course of geological history, by the same deep structure now responsible for volcanism in Iceland. Basal ice may affect the increase in ice flow velocity at the Petermann glacier and in the Northeastern Greenland Ice Stream”.
“The research”, he concludes, “highlights the importance of the interaction between solid earth and the dynamics of the ice cap. These interactions control past, present and future flow dynamics and must be adequately explored and implemented in models of the ice sheet".
Link:

Fig.1 – Bassa velocità delle onde sismiche sotto la calotta glaciale è associata a temperatura più alta. La mappa a) mostra la variazione della velocità delle onde di Rayleigh (rosso: più lente; blu: più veloci) 4 km sotto la superficie del ghiaccio, misurata da questo studio. La mappa b) mostra il modello di flusso di calore nella crosta terrestre, secondo Martos et al., 2018, Geophys. Res. Lett., 45, 8214-8222): il giallo indica maggiore calore.
Fig. 1 – a Vs at 4 km depth calculated at each seismic station (triangle) and interpolated onto a 0.25∘ × 0.25∘ grid. b Geothermal heat flux at the ice-bedrock interface taken from Martos et al.

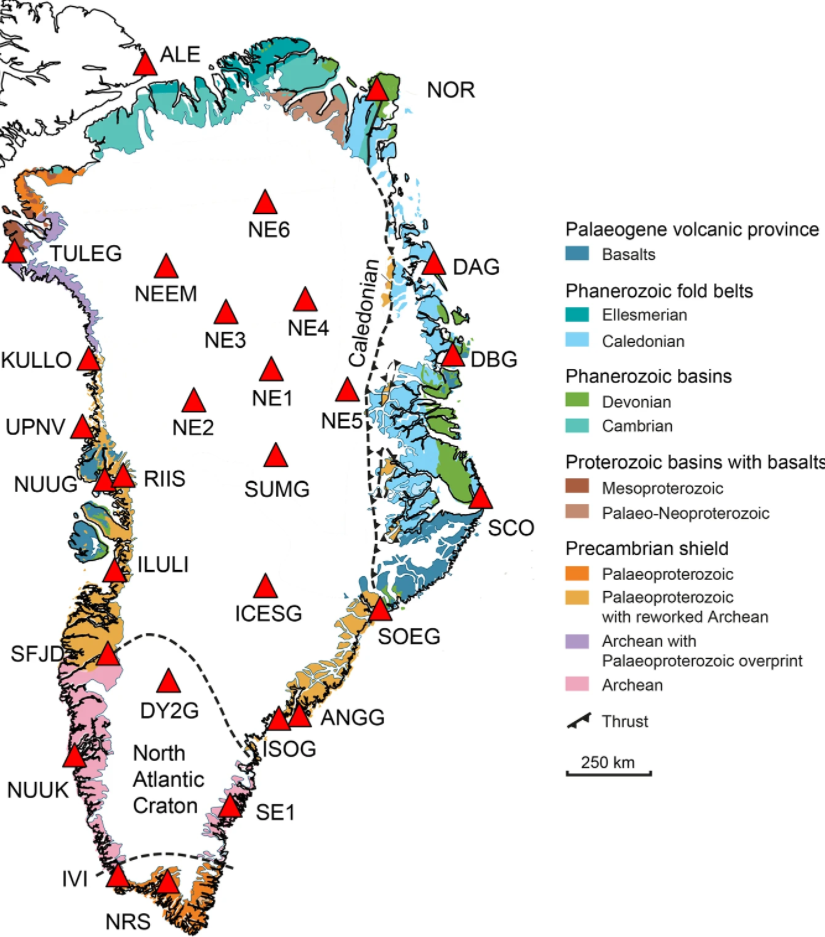
Fig. 2 – Carta geologica della Groenlandia. Le unità geologiche affioranti sono indicate dai diversi colori. I triangoli rossi indicano le stazioni sismiche (con i loro codici) usate nello studio.
Fig. 2 – Geological units are shown in colour (modified after Dawes76) and the red triangles are the locations of the seismic stations used in this study.


